
The Great Pause: GTA Sales Slide 9% as Buyers Wait Out the Noise
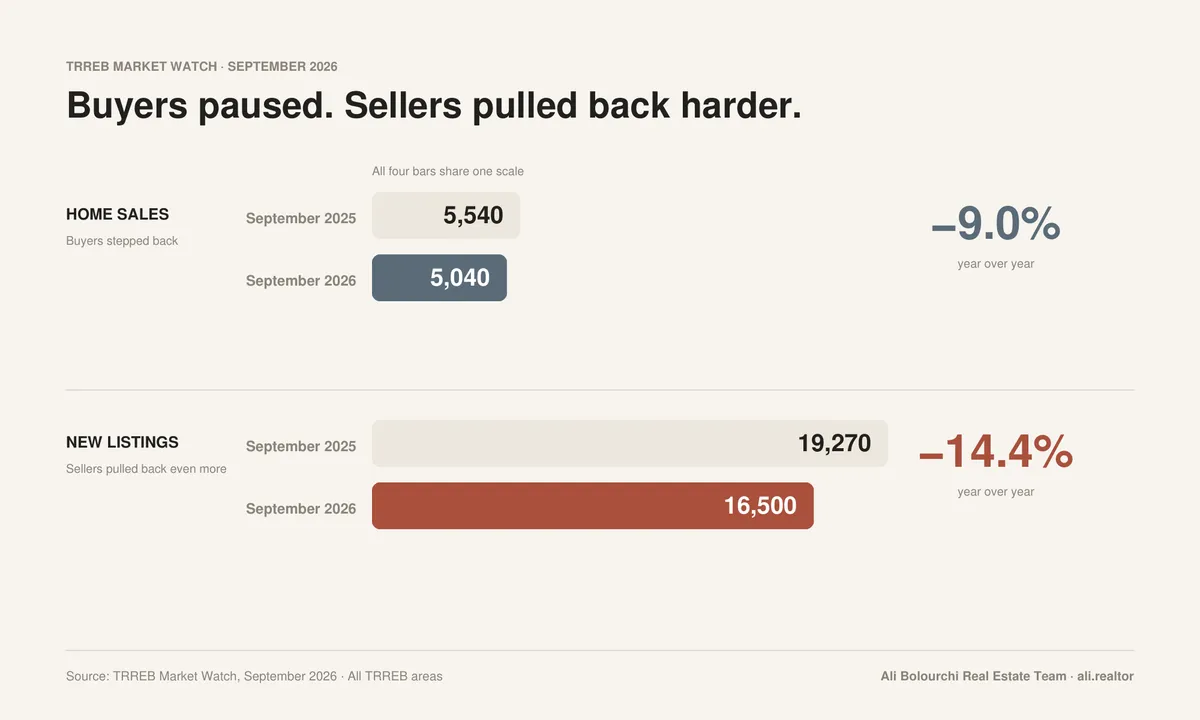
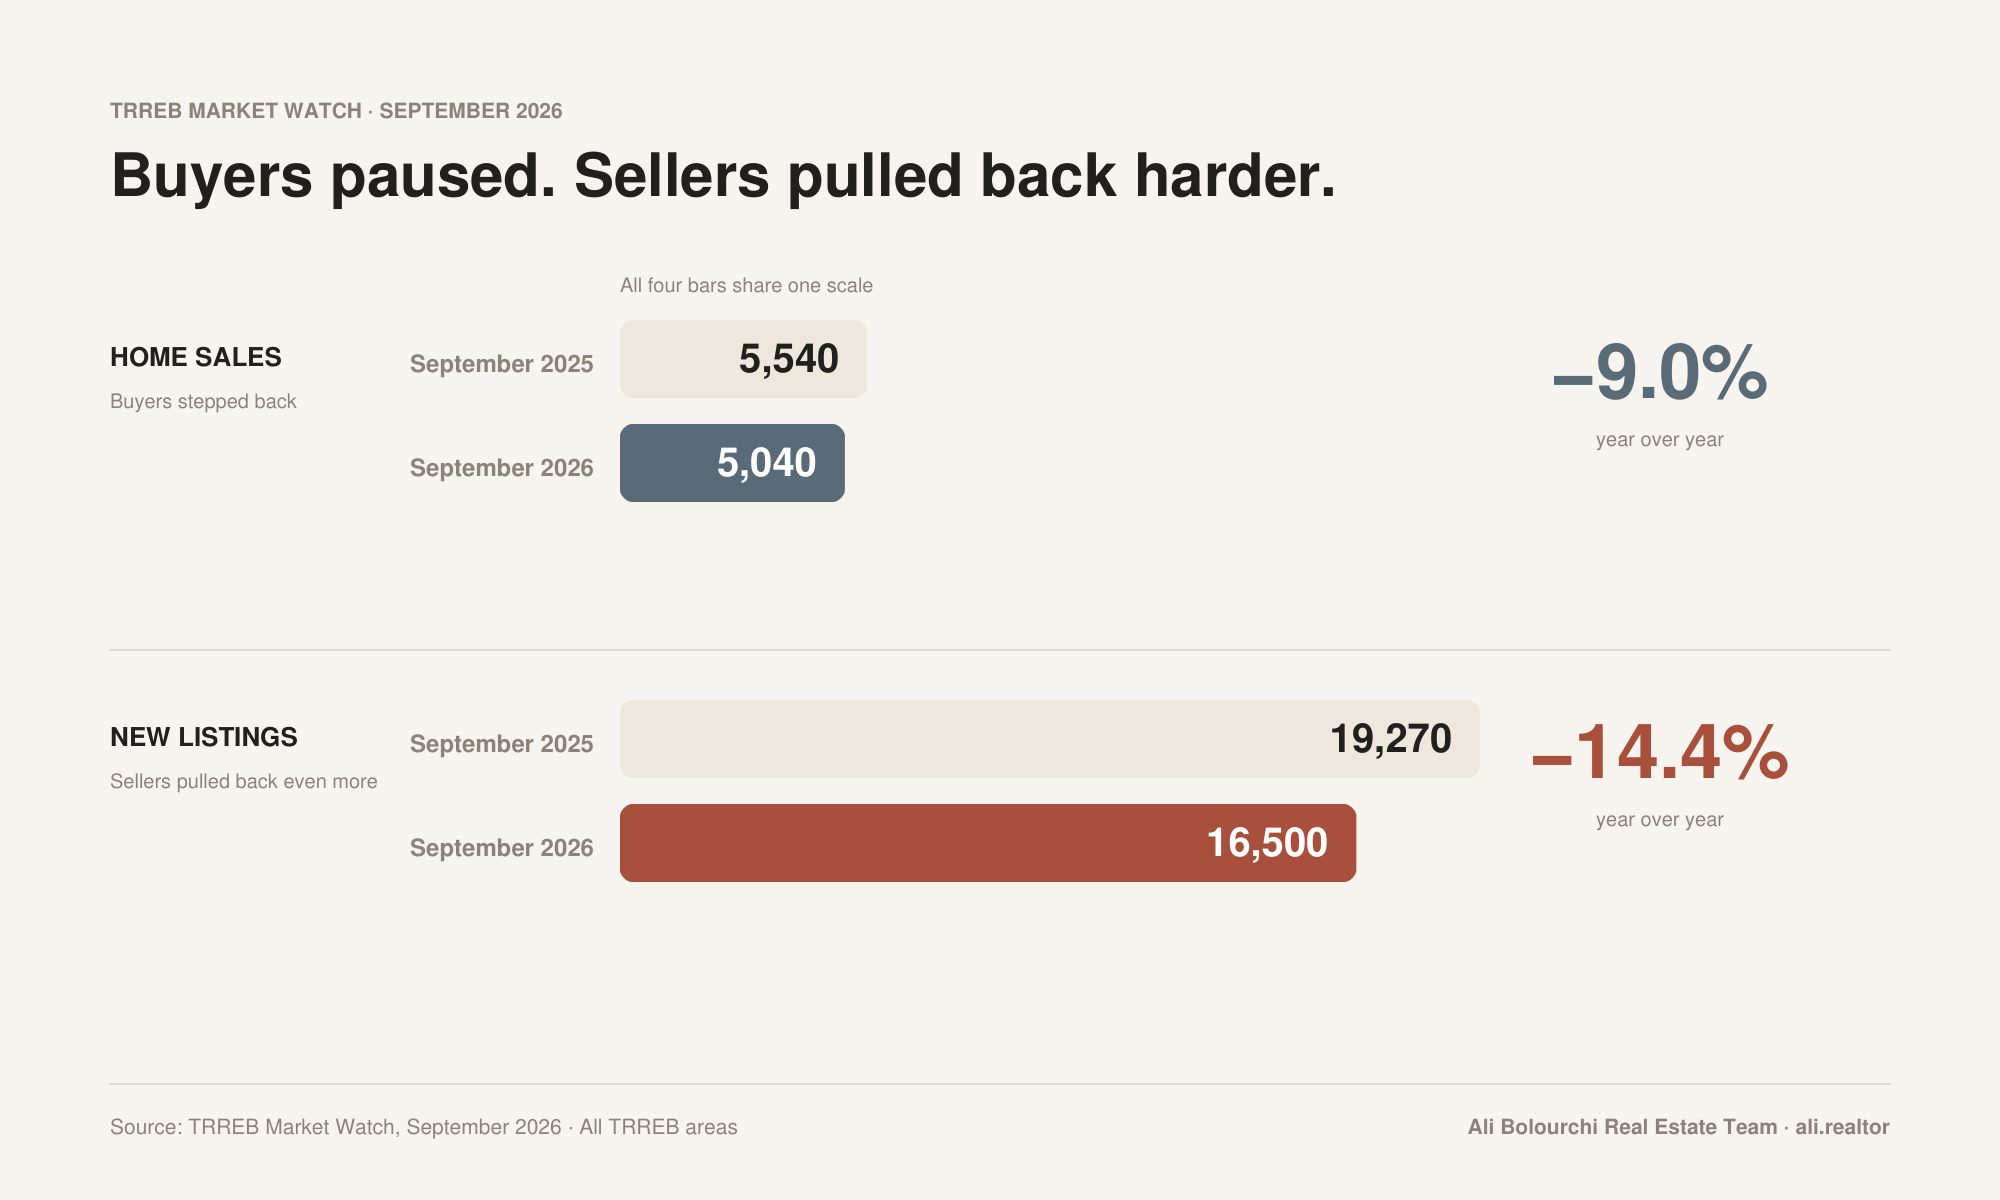
September was the month the GTA held its breath. Home sales fell 9.0% from last September to 5,040, but sellers pulled back even harder, with new listings dropping 14.4% to 16,500. Buyers are waiting on the municipal election, inflation and borrowing costs. Sellers are waiting on buyers. The result is a market that is quiet, not broken.
TRREB's own description is a market in a holding pattern. On a seasonally adjusted basis, both sales and new listings were down from August, and the MLS® Home Price Index Composite benchmark was down 4.7% year over year. The average selling price came in at $1,006,409, down 5.1% from a year ago.
That is a change in tone from the summer. In July we wrote about a supply squeeze driven by an 18% plunge in new listings while sales held steady. In August, sales were down just 2.1% and the sales-to-new-listings ratio was 41.9%, up from 36.8% a year earlier. This September, the sales decline widened to 9.0%. Supply is still thin, but demand has now stepped back too, and the details by property type tell a more nuanced story than a simple tightening.
September 2026 at a Glance
- Home sales: 5,040, down 9.0% year over year (September 2025: 5,540)
- New listings: 16,500, down 14.4% (September 2025: 19,270)
- Active listings: 26,131, down 9.3% (September 2025: 28,813)
- Average selling price: $1,006,409, down 5.1% (September 2025: $1,060,036)
- MLS® HPI Composite: down 4.7% year over year
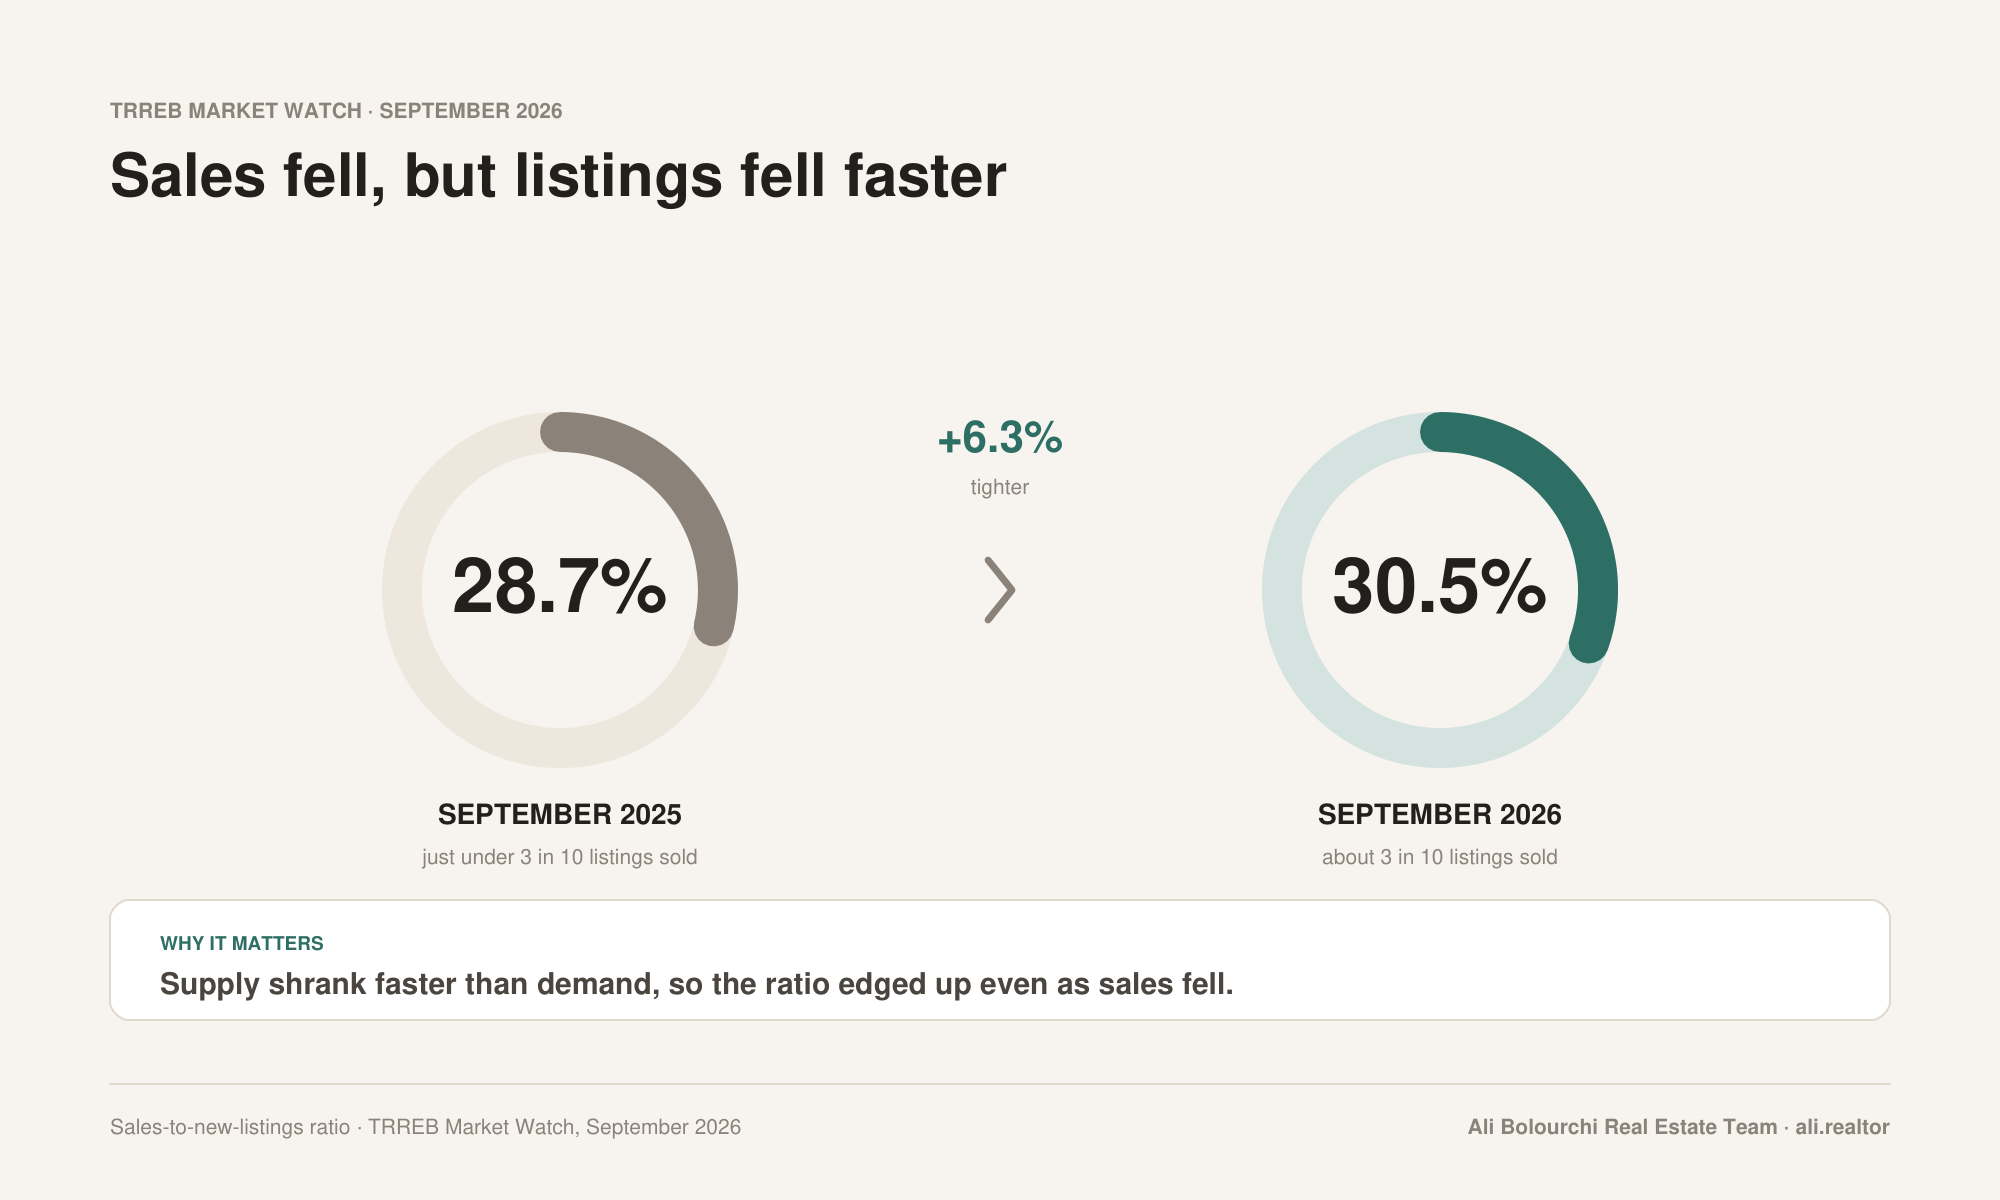
- Sales-to-new-listings ratio: 30.5% (sales divided by new listings), up from 28.7% a year ago
- Average listing days on market: 34, versus 33 a year ago. Average days on market including relistings: 51, unchanged
- Months of inventory: 4.6, with homes selling at an average of 98% of list price
Here is why the ratio edged up even as sales fell. New listings dropped 14.4% while sales dropped 9.0%, so supply shrank faster than demand. Roughly three in ten new listings found a buyer this September, compared with a little under three in ten a year ago. That is a much smaller edge over last year than in August, when the ratio ran 5.1 points above the year before. In September it is 1.8 points above. With 4.6 months of inventory and homes closing at 98% of asking, this is a market where buyers still have room to negotiate, and where sellers who price correctly are still getting deals done.
One note before the property types: average prices move with the mix of homes that sell in a given month, so treat one month's change as a signal, not a verdict.
Detached Homes: Toronto Holds Volume, Gives Up Price
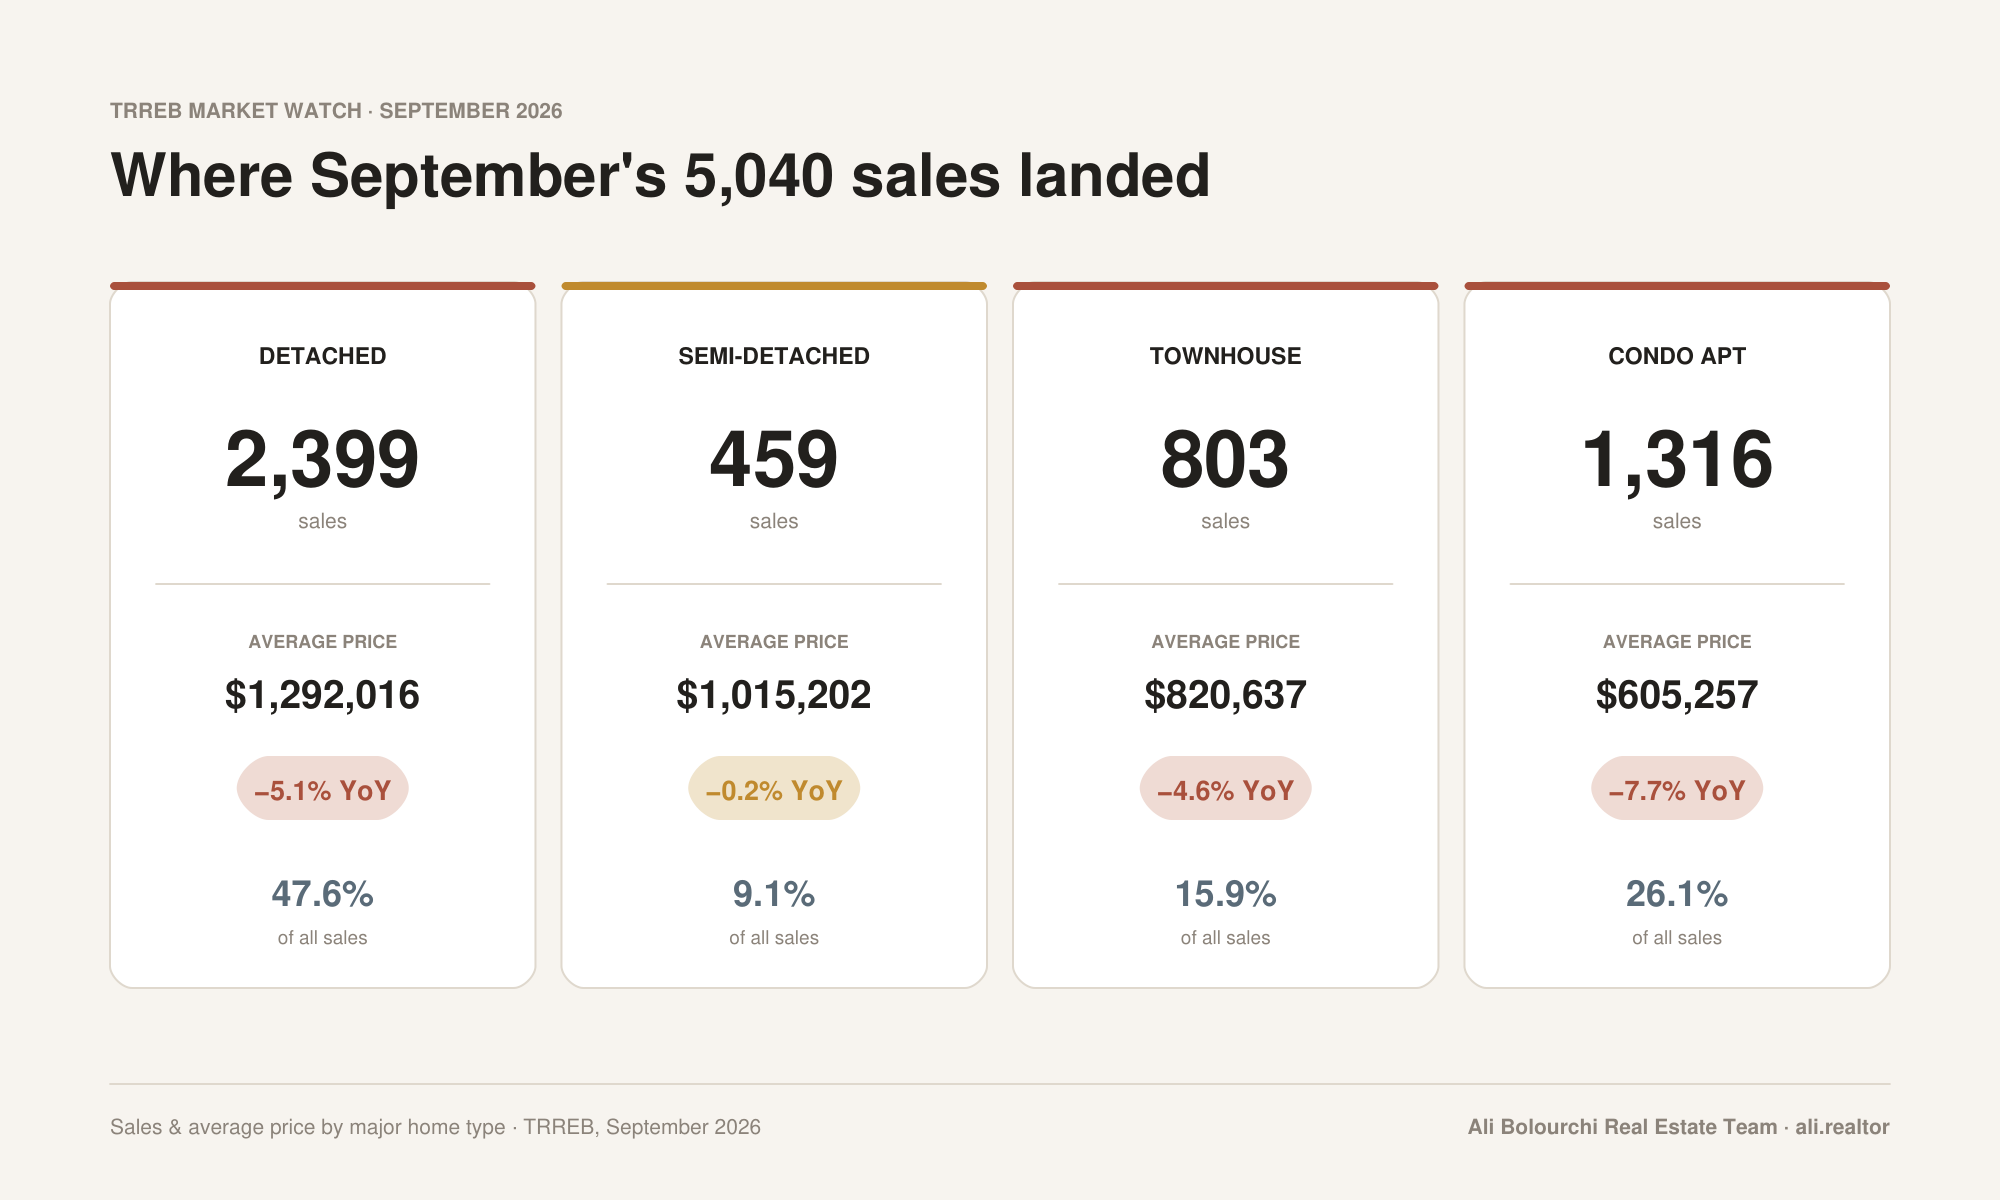
Detached homes accounted for 2,399 sales, 47.6% of all GTA transactions, at an average price of $1,292,016 (down 5.1%). Sales were down 8.7% overall.
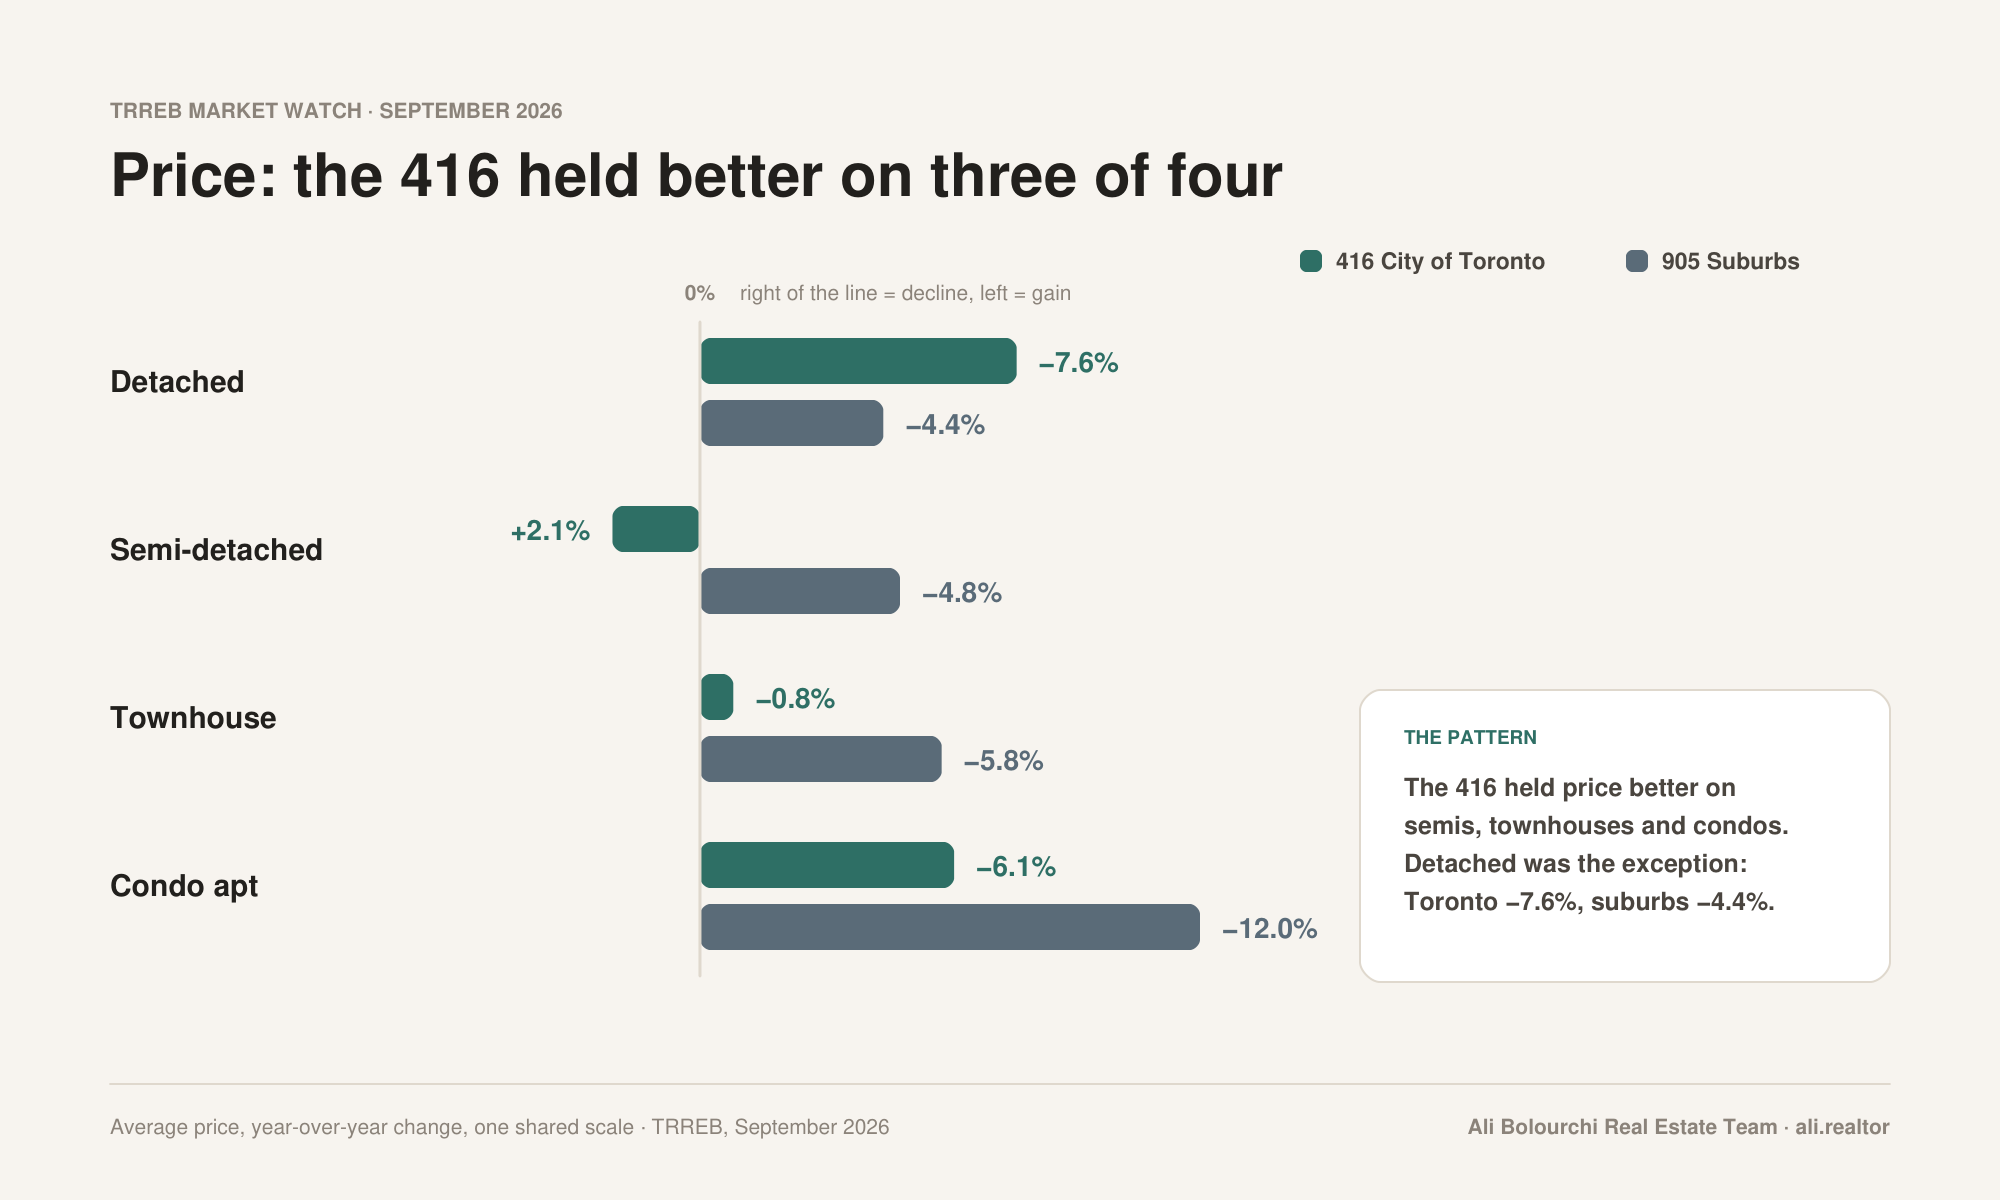
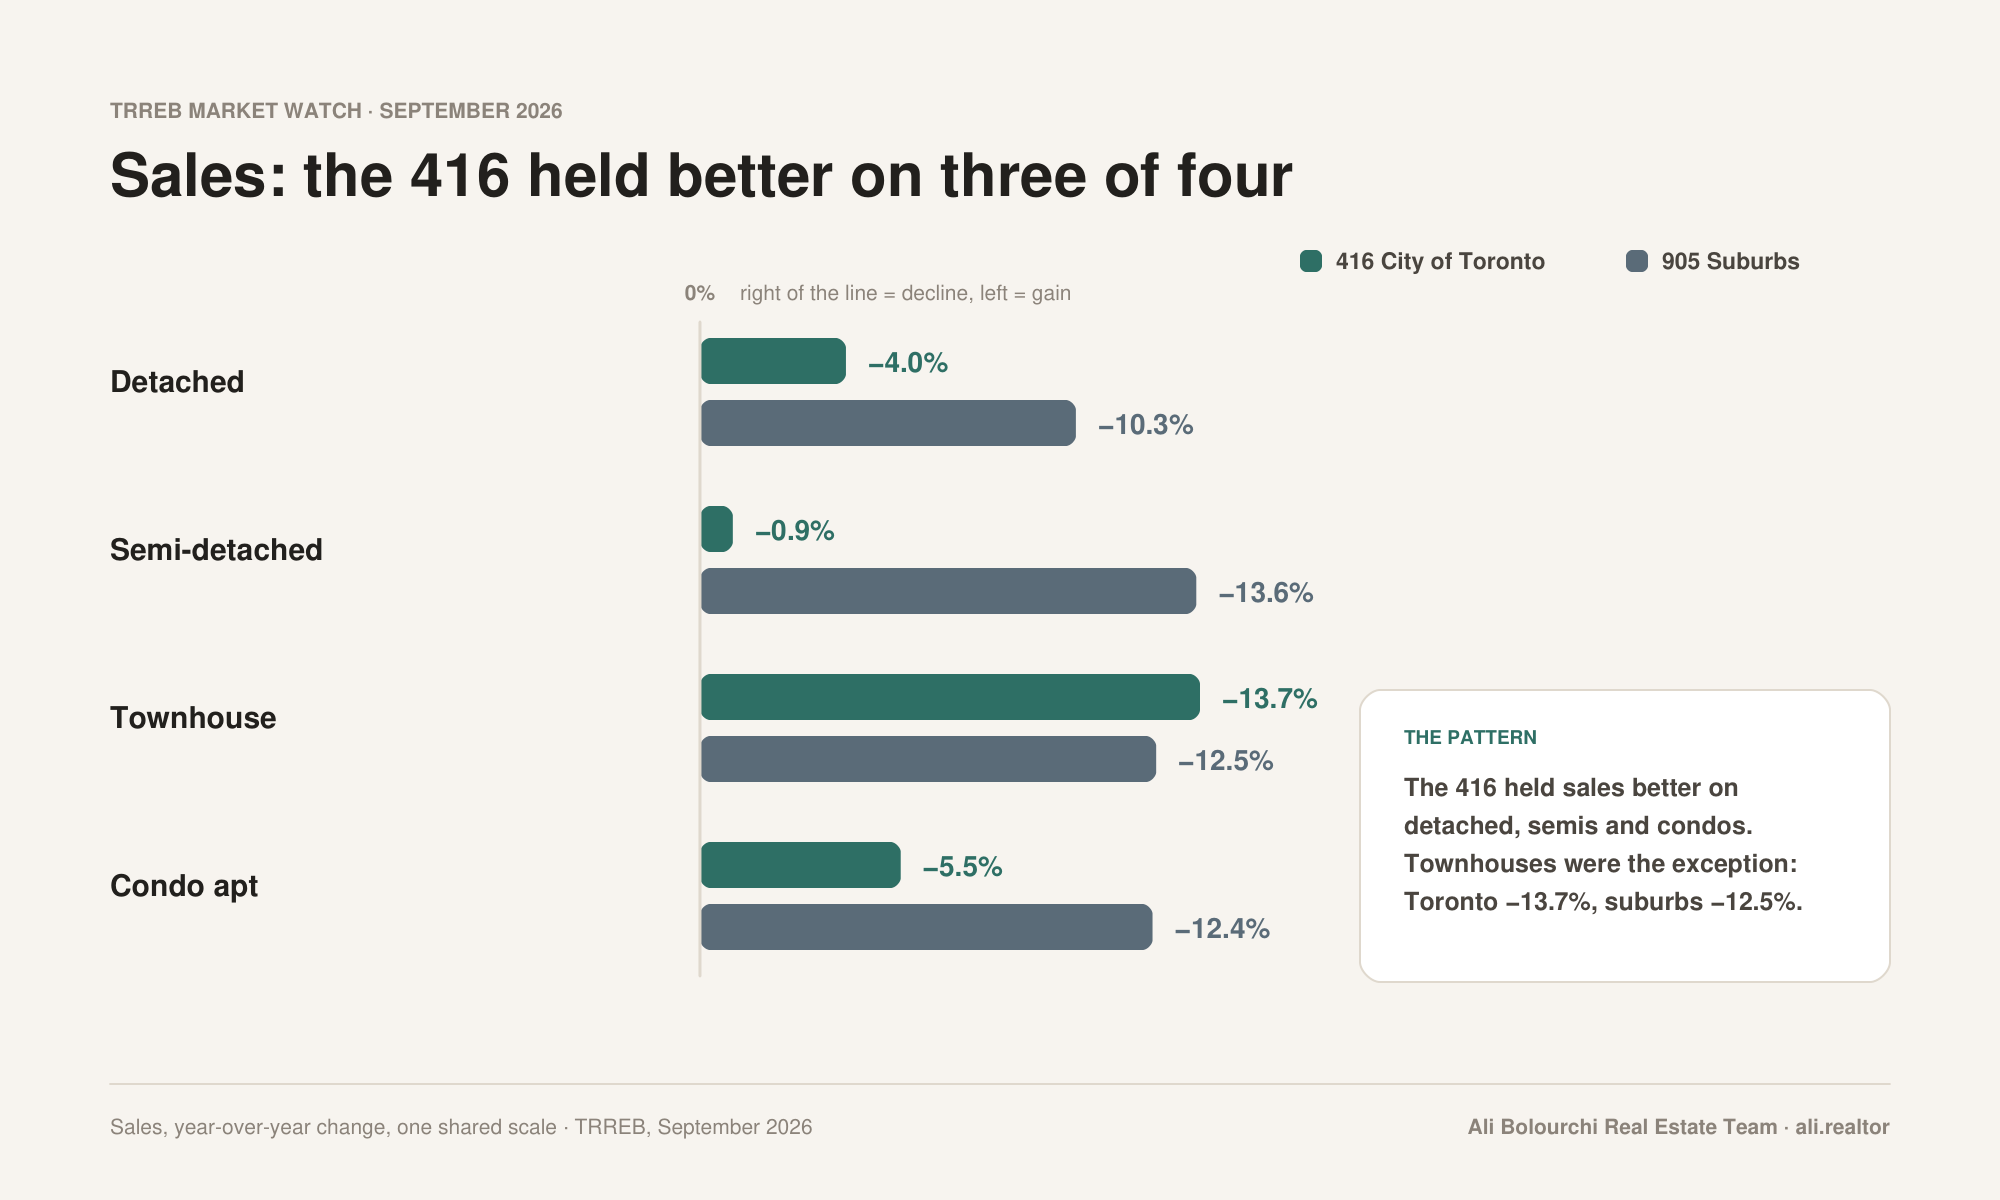
- City of Toronto (416): 640 sales, down 4.0%. Average price $1,562,966, down 7.6%
- Suburbs (905): 1,759 sales, down 10.3%. Average price $1,193,432, down 4.4%
Insight: In July and August we wrote that the 416 detached market was quietly outperforming. In July its price was down just 1.5% against 6.7% in the 905. In August it was down 0.1% with sales up 3.6%, against a 2.6% price decline in the 905. September breaks that run on price. Toronto detached prices fell 7.6%, well above the 4.4% decline in the 905, even though 416 sales (down 4.0%) still held up better than the suburbs (down 10.3%). Toronto sellers appear to be meeting buyers on price to keep deals moving, while suburban sellers are holding firmer and closing fewer.
Semi-Detached: The One Segment Where Prices Rose
Semi-detached homes recorded 459 sales at an average price of $1,015,202, down just 0.2% year over year. Sales were down 8.2%.
- City of Toronto (416): 211 sales, down 0.9%. Average price $1,207,884, up 2.1%
- Suburbs (905): 248 sales, down 13.6%. Average price $851,266, down 4.8%
Insight: In July we flagged Toronto semis as an opportunity, with prices down 9.9% year over year. In August the decline had narrowed to 1.8%. In September the 416 semi price is up 2.1%, the only one of the eight 416 and 905 segments on this report to post a price gain. Sales barely moved in the city (down 0.9%) while the 905 fell 13.6%. Buyers who acted on that flag have seen the discount close.
Townhouses: Prices Hold in the City While Sales Keep Sliding
Townhouses posted 803 sales at an average price of $820,637, down 4.6%. Sales fell 12.8%, the steepest drop of the four major types.
- City of Toronto (416): 189 sales, down 13.7%. Average price $922,445, down 0.8%
- Suburbs (905): 614 sales, down 12.5%. Average price $789,299, down 5.8%
Insight: Townhouses are the exception to this month's sales pattern. The 416 held up better than the 905 on sales for detached, semis and condos, but not here: Toronto townhouse sales fell slightly harder than the suburbs. After a jump of 8.7% in July, 416 townhouse sales were down 11.3% in August and are down 13.7% now. The price story flipped the other way: the Toronto average was down 12.9% in August and is down just 0.8% in September. That looks like a standoff, with fewer deals getting done but sellers not cutting.
Condo Apartments: The Bottom Call Was Early
Condo apartments recorded 1,316 sales, 26.1% of the market, at an average price of $605,257, down 7.7%. Sales were down 7.8%.
- City of Toronto (416): 884 sales, down 5.5%. Average price $640,248, down 6.1%
- Suburbs (905): 432 sales, down 12.4%. Average price $533,654, down 12.0%
Insight: In July, the 416 condo price decline had compressed to 1.6% and we said that was what a bottom looks like. August's 2.1% decline was still close to flat. September does not confirm the call. The 416 condo decline has widened to 6.1%, and the 905 condo market, down 7.6% in August, posted the steepest price decline of any segment on the report at 12.0%. The 416 is still holding up about twice as well as the suburbs, but a floor has not been established. Condo buyers have leverage. Condo investors should be patient, not early.
The Economic Backdrop
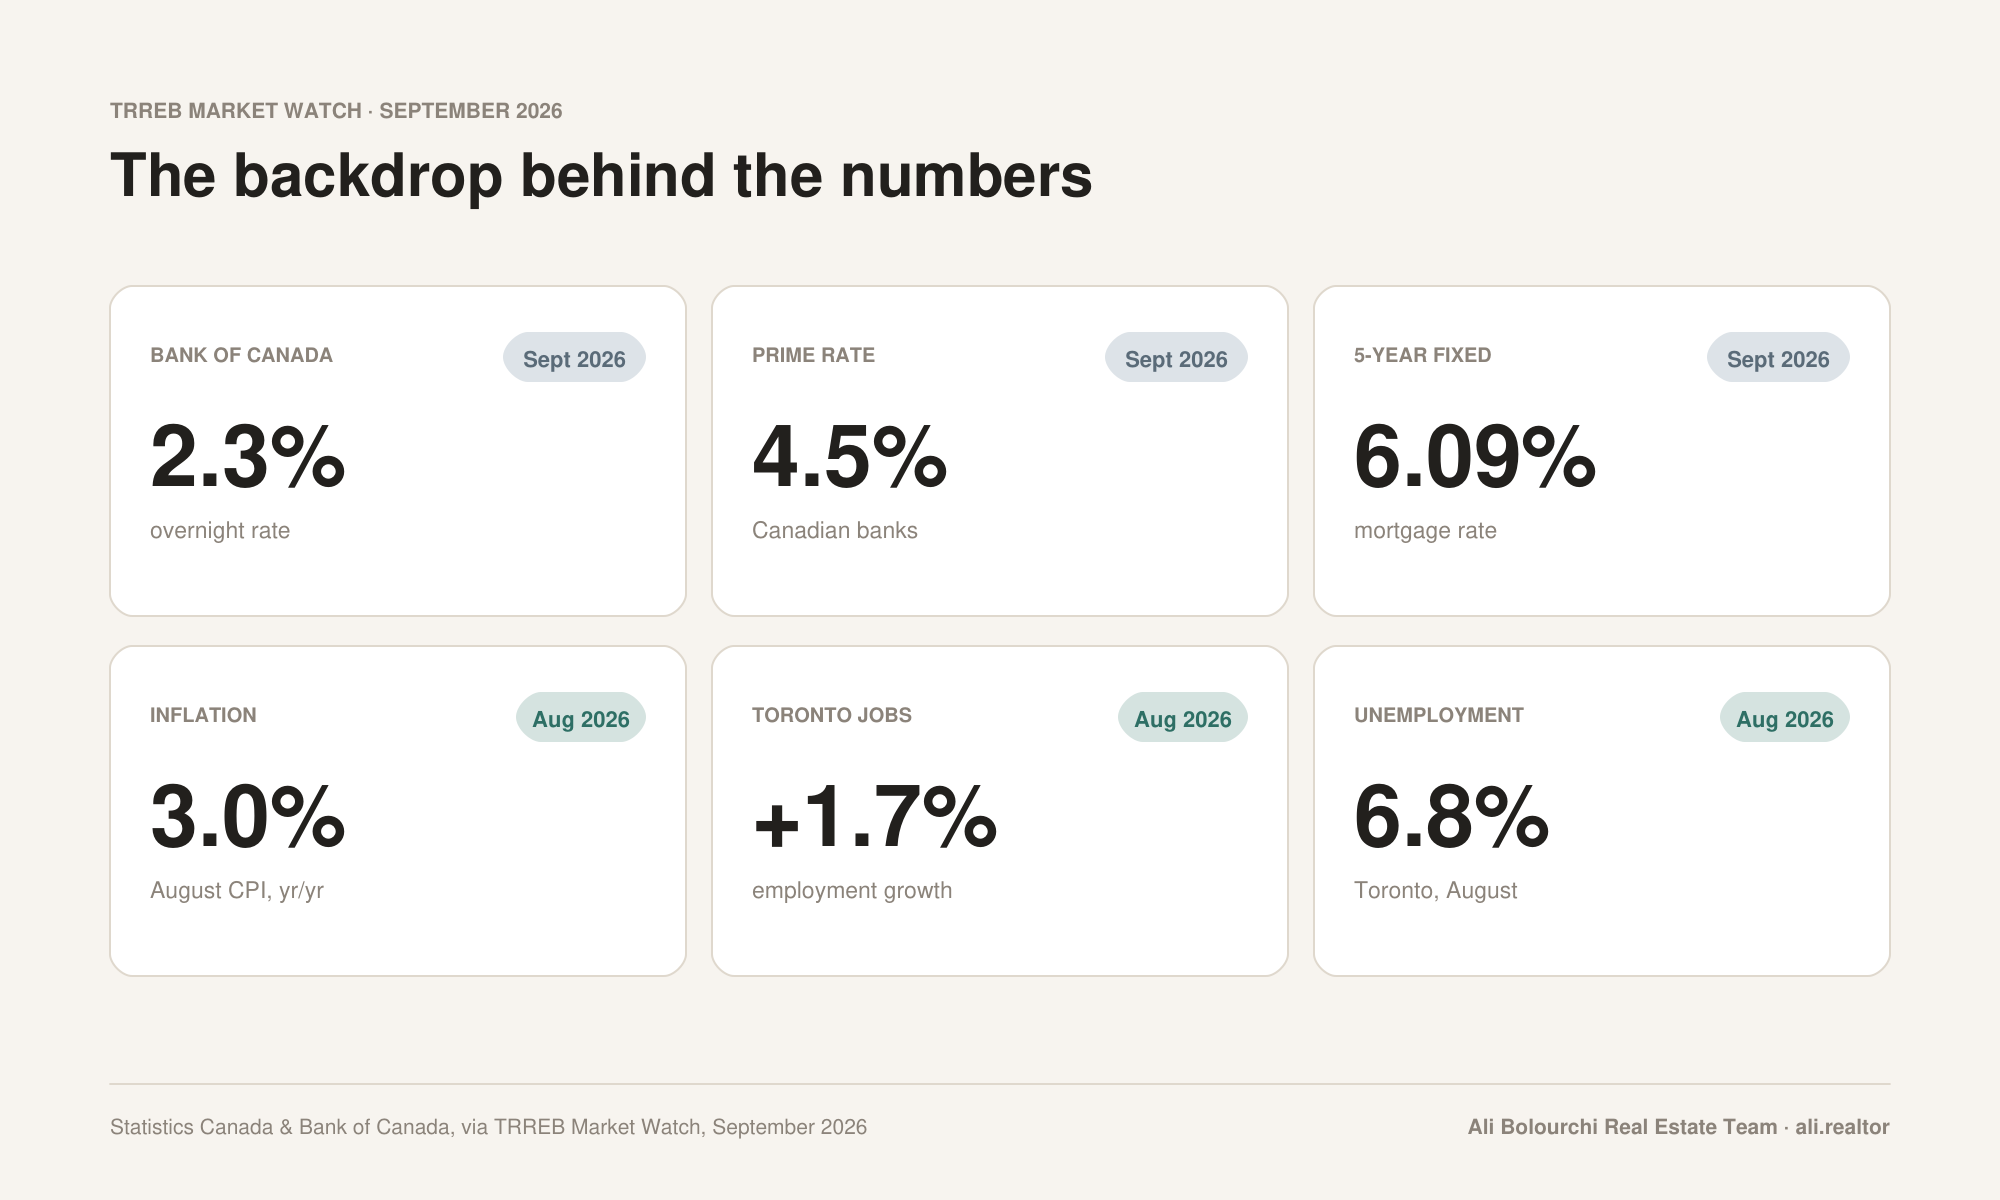
The macro picture is mixed. Real GDP grew 3.3% in the second quarter on an annualized basis, and Toronto employment grew 1.7% in August. The Toronto unemployment rate stood at 6.8%, and inflation ran at 3.0% year over year. The Bank of Canada overnight rate is 2.3% (prime: 4.5%), and mortgage rates sit at 5.49% for 1 year, 6.05% for 3 years and 6.09% for 5 years.
TRREB President Daniel Steinfeld pointed to the calendar: "Housing is one of the biggest issues on voters' minds, and the upcoming municipal election will help shape housing policy across the GTA and Simcoe County for the next four years. The decisions our next mayors and councillors make on affordability, housing supply and the costs associated with buying a home can also influence buyer demand and confidence in the market."
Chief Information Officer Jason Mercer said the demand has not gone away: "We know there is substantial pent-up demand in the GTA, with many households fully intending on purchasing a home in the months ahead. These would-be homebuyers want to take advantage of today's more affordable housing market, but they need to be confident that their employment situation will remain solid and inflation will not put pressure on borrowing costs over the long term."
And CEO John DiMichele called on governments to "make homeownership more attainable by reducing barriers such as Toronto's Municipal Land Transfer Tax and opposing its expansion across the GTA and Simcoe County," adding that with trade uncertainty and tariffs still affecting the economy, a strong housing sector is critical to consumer confidence and growth.
What This Means for You
If You're Buying
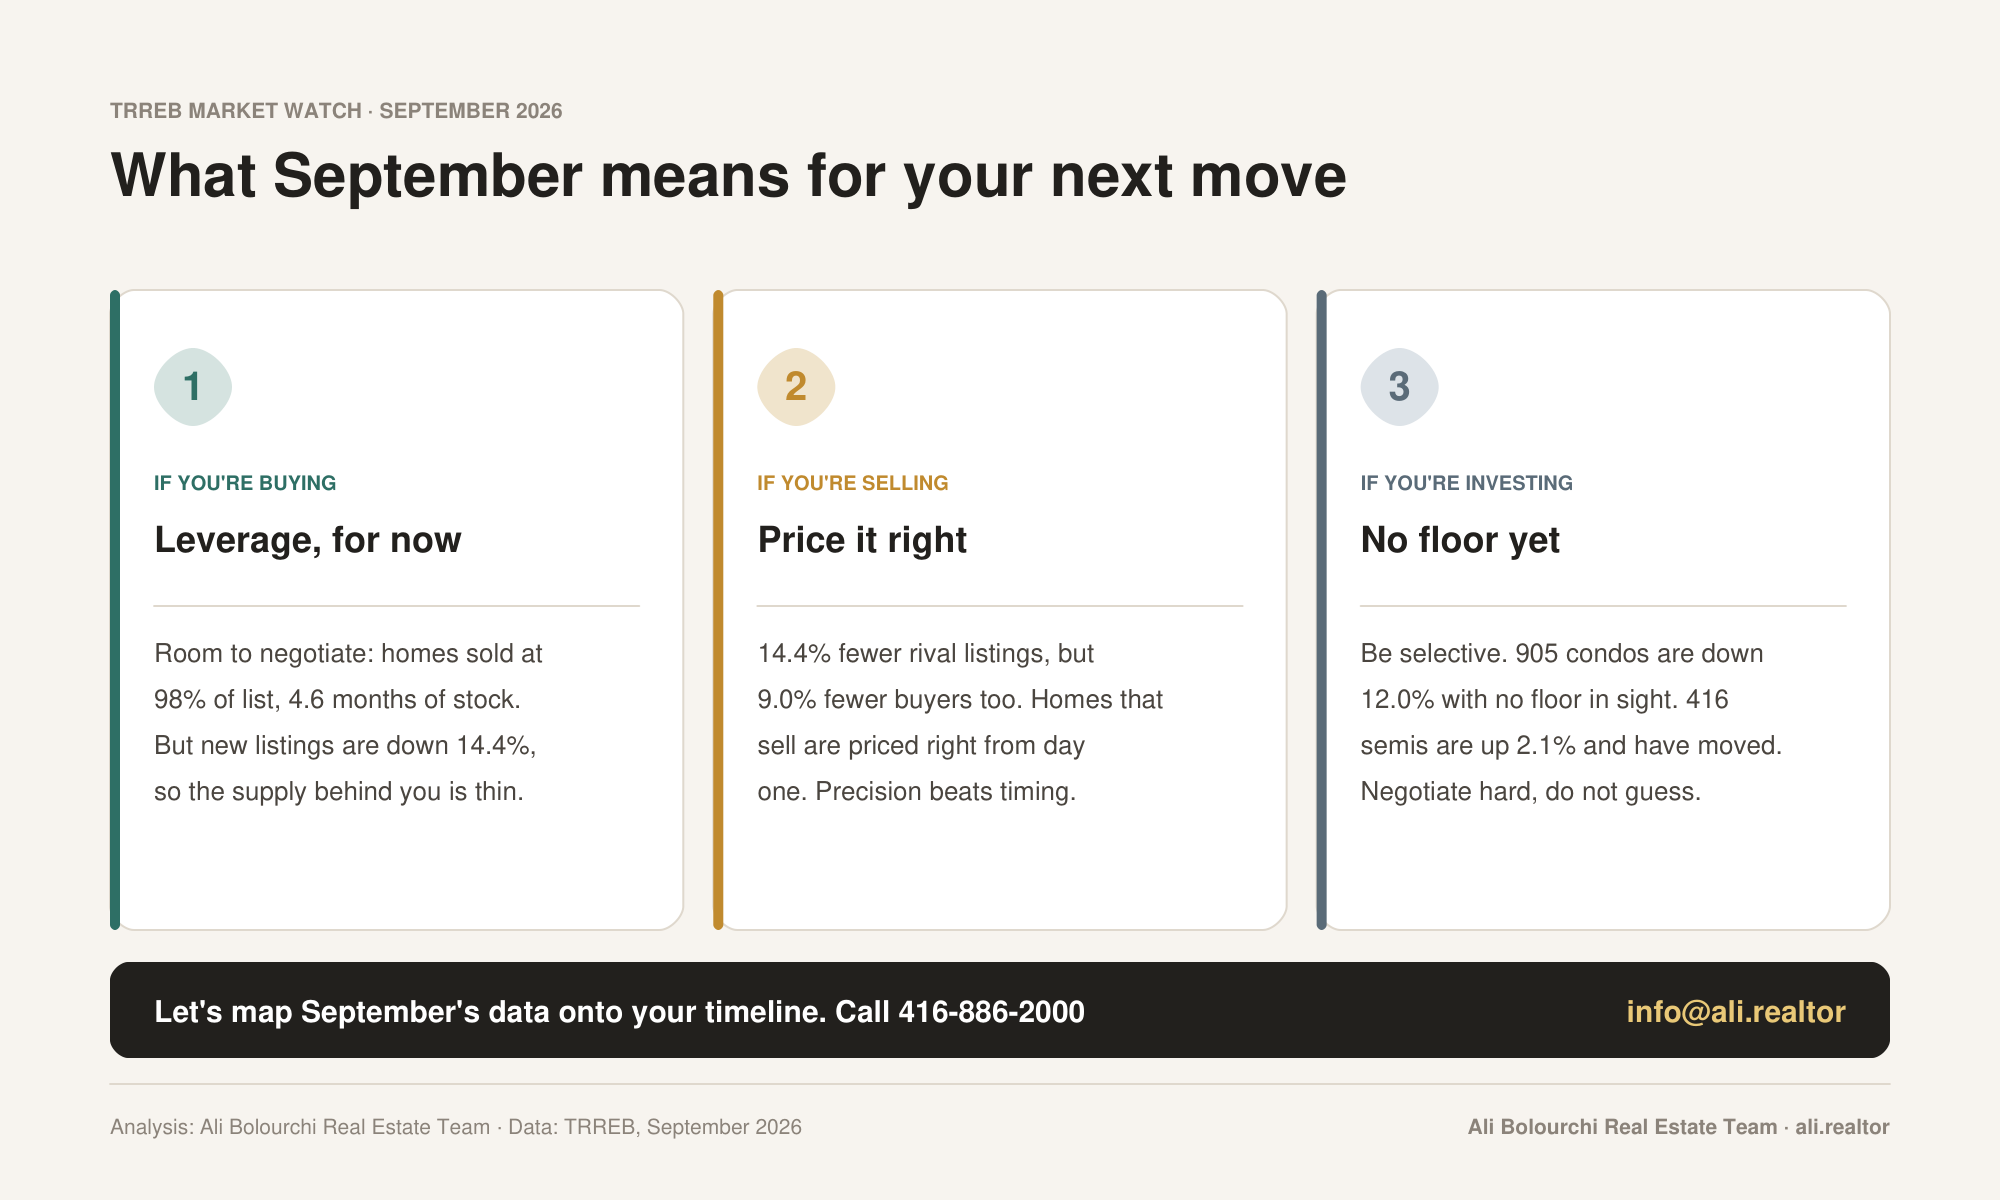
A pause is when buyers have the most room. With 4.6 months of inventory, homes closing at 98% of list and 34 days to sell, you can negotiate. But the same pause that gives you leverage is thinning the supply behind it: new listings are down 14.4%. If the pent-up demand Mr. Mercer describes returns all at once, it will meet fewer homes. Get pre-approved, know your target segment, and use this window to shop with less pressure.
If You're Selling
You face 14.4% fewer competing listings than last September, but 9.0% fewer buyers too, and prices are down 5.1% year over year. The homes that sell are priced to the current market from day one. Overpriced listings sit, which is how you end up past 51 days on market. Preparation and pricing precision matter more than timing.
If You're Investing
Be selective. The suburban condo market is where prices are falling fastest (down 12.0%), and the data does not yet show a floor. Toronto semis, up 2.1%, have already moved. The opportunity this month is in negotiating well on the segments with the most weakness, not in calling the bottom. Watch the next two reports for a sustained narrowing in the 416 condo decline before treating it as a turn.
Where does September's data leave your plans?
Every pause creates a window for someone. Let's talk about which side of it your strategy puts you on, with numbers specific to your neighbourhood, property type and timeline.
Ali Bolourchi Real Estate Team
Phone: 416-886-2000
Email: [email protected]
Websites: ali.realtor | GTALuxuryHomes.ca | The4Sale.com
Source: Toronto Regional Real Estate Board (TRREB) Market Watch, September 2026. Statistics reflect all TRREB areas. Months of inventory and sale-to-list figures are from page 3 of the report. Sales-to-new-listings ratio is calculated as sales divided by new listings. This article is for information purposes only and is not intended to solicit buyers or sellers currently under contract with a brokerage.